

Logs
Inspect local and published backend logs, follow requests live, and export logs for debugging.
Open Logs in your project's sidebar to inspect backend requests, console messages, and errors. Messages from the same request are grouped together so you can follow what happened without searching through separate entries.
Choose Local or Online
- Local shows logs from the project's local development workspace. Start the preview and make a request to your app to generate logs. Local logs come from the running workspace's buffer, so the available history may be shorter than your plan's time limit.
- Online shows logs from your published project. Use the Deployment filter to inspect all deployments, the current production deployment, or a specific release.
Both tabs use the same table, filters, and export menu. These are backend logs; browser console messages are not part of the request log stream.
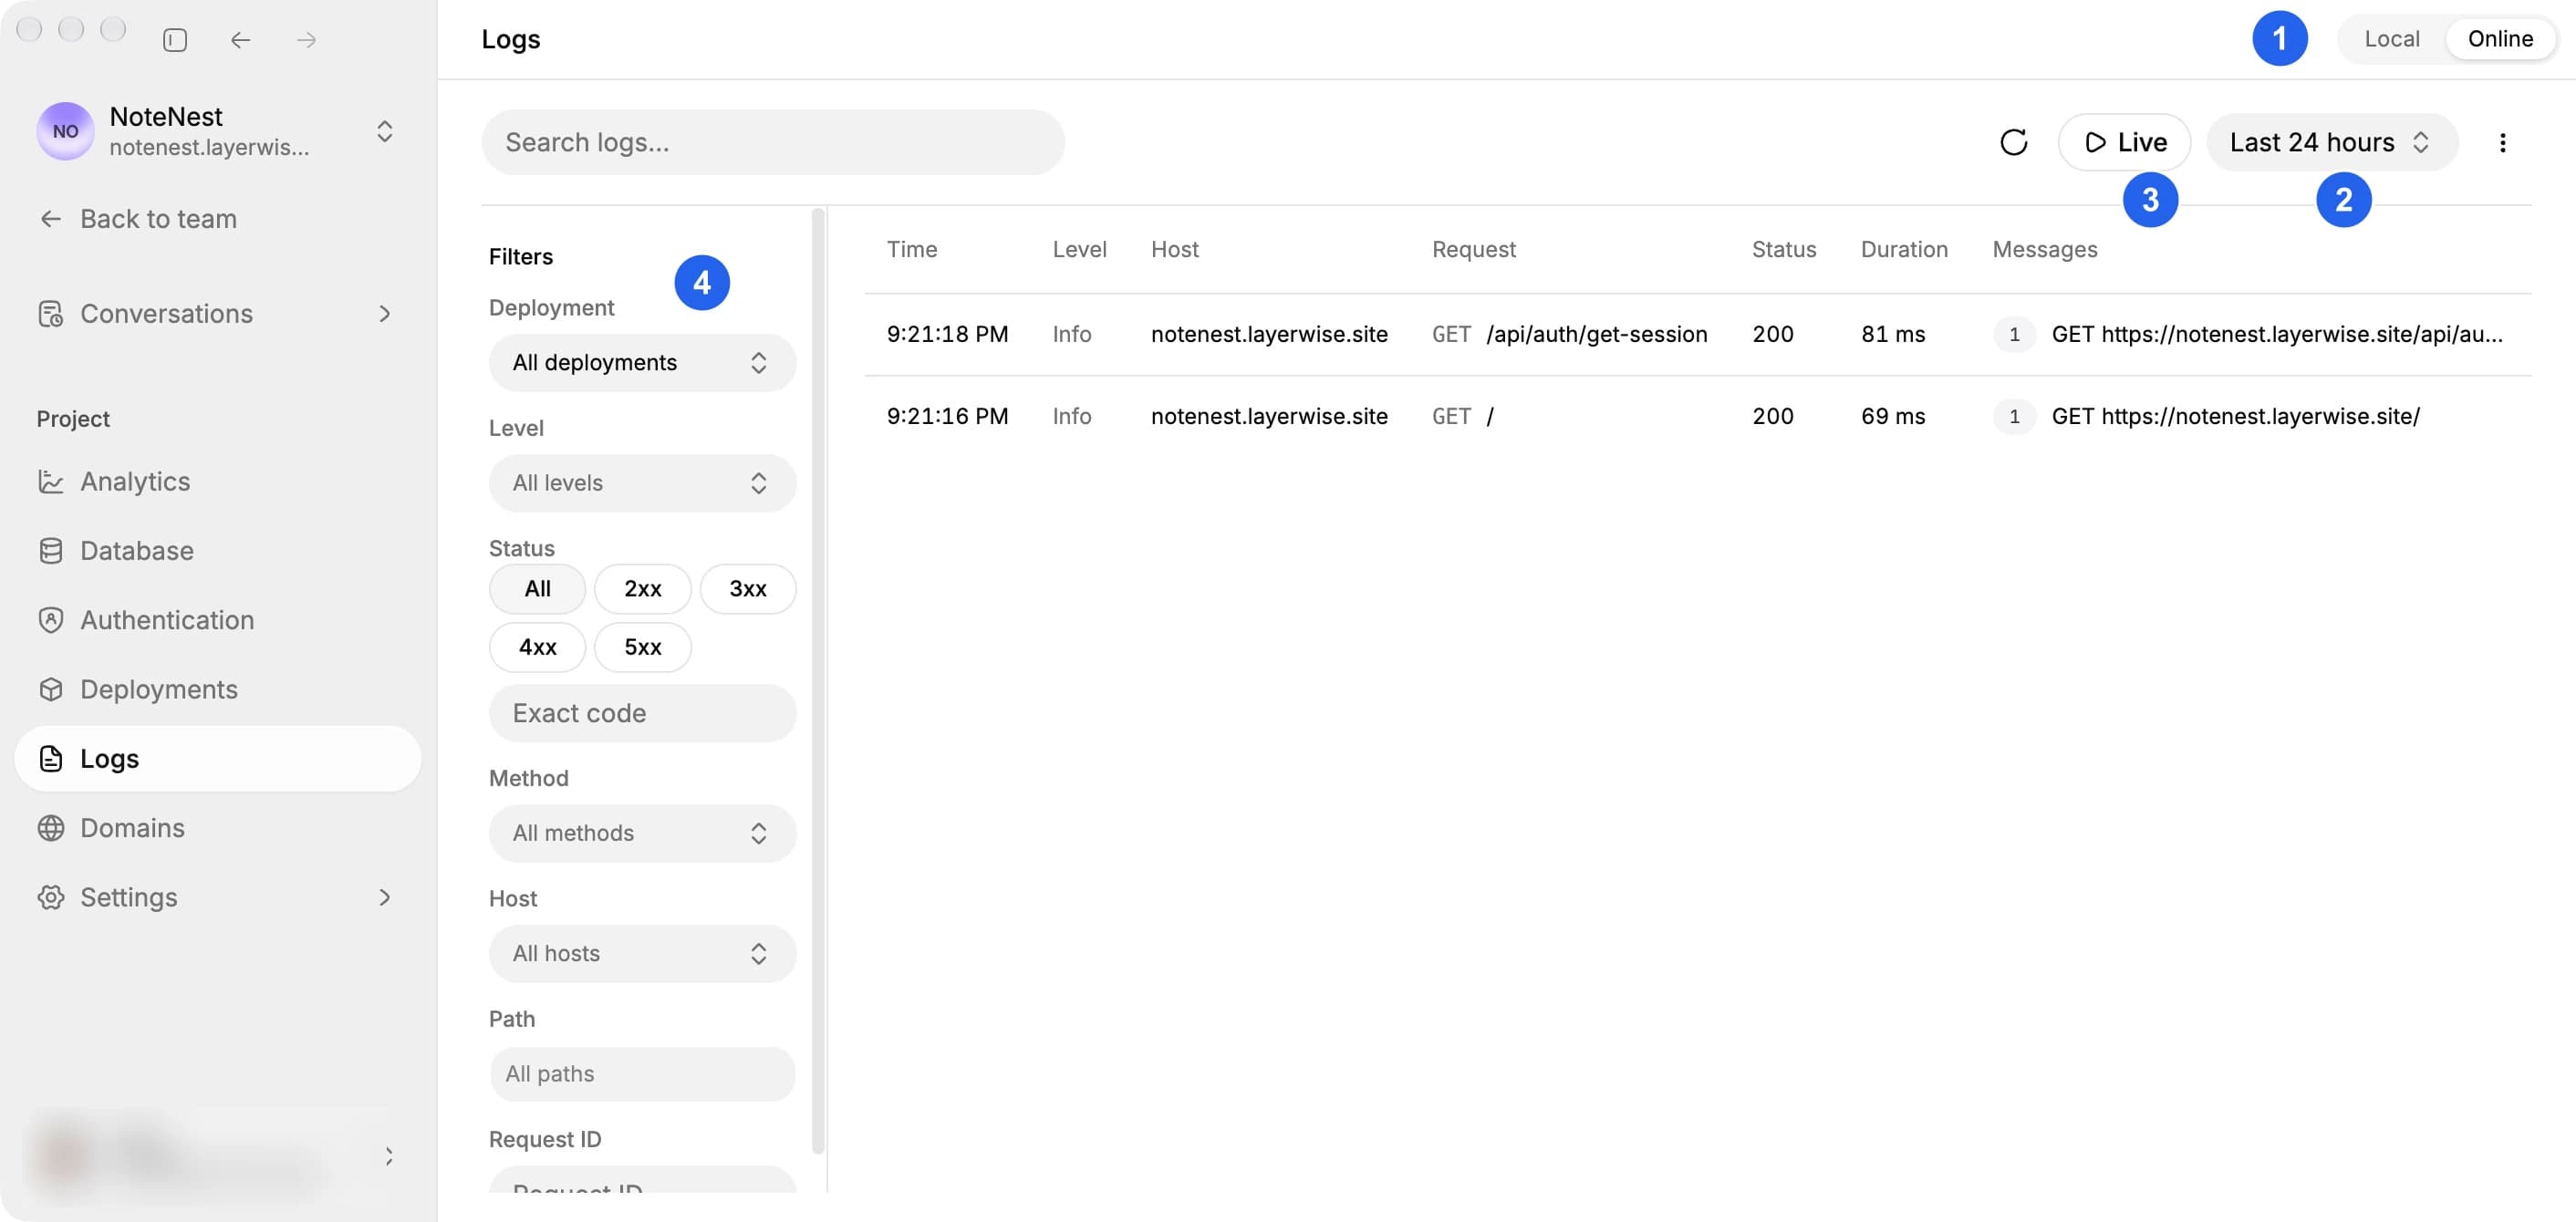
(1) Choose the environment, (2) select a time range, (3) follow logs live, and (4) narrow the requests with filters.
Read a request
The table shows Time, Level, Host, Request, Status, Duration, and Messages. Times use your computer's local time zone. A dash means the value was not recorded, which can happen for local process output that is not an HTTP request.
The tag beside a message counts the loaded log events for that request, including its request event. The row previews an error message when one is available. Scroll down to load more requests automatically.
Click a row to open its details. You can inspect the request ID, URL, status and outcome, timing, deployment, and individual messages. Expand structured data or long messages when available. Use Copy request ID, Copy loaded logs, or a message's Copy action to share the relevant context.
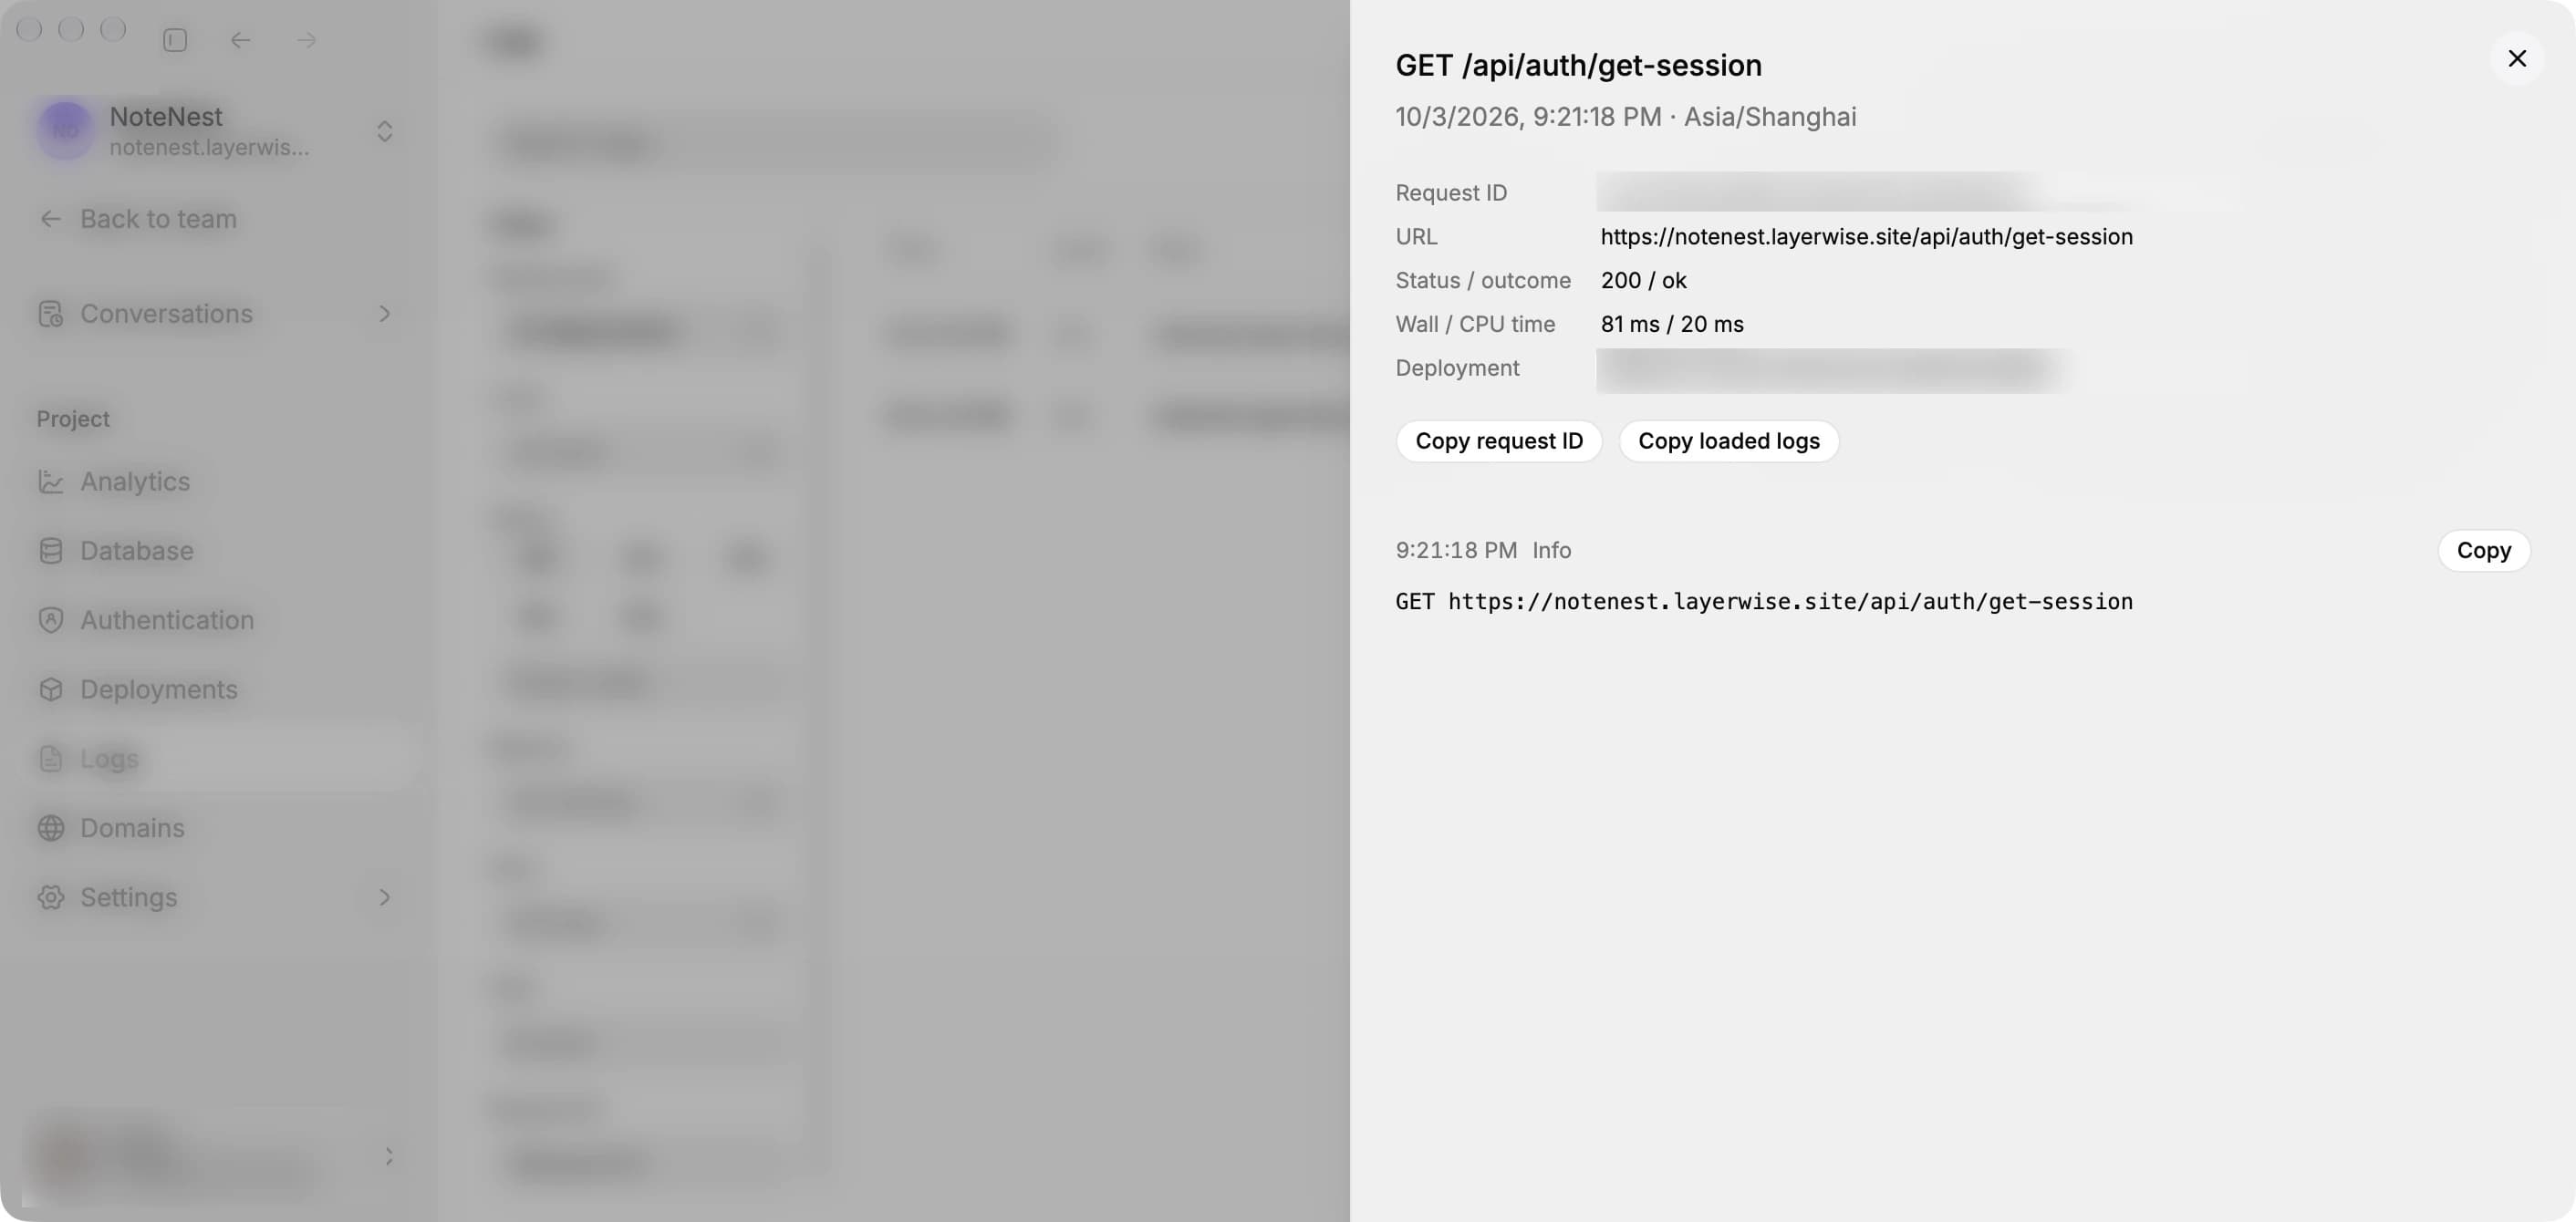
Open a request to inspect its status, timing, and messages. Request identifiers and sensitive data are blurred.
Choose a time range
The time selector offers Last 15 minutes, Last 30 minutes, Last hour, Last 24 hours, Last 3 days, and Last 7 days.
On Pro and higher plans, choose Custom range for an exact interval. Select dates in the calendar, adjust the From and To times, and select Apply. The dialog checks that the start is before the end, both dates are within your available history, and the end is not in the future. Live updates are unavailable for a custom range.
History available on your plan
| Team plan | Available history | Custom range |
|---|---|---|
| Free | Latest 1 hour | No |
| Pro | Latest 3 days | Yes |
| Business | Latest 7 days | Yes |
| Enterprise | Latest 7 days | Yes |
These limits apply to both Local and Online. All time options remain visible. A plan tag appears only beside an option your team has not unlocked; selecting it opens the upgrade dialog without changing your current filters. See Billing and usage to manage your team's plan.
Filter logs
Use Search logs to find text in log messages and request information. Press Enter or leave the search field to apply it. Combine it with the filters on the left:
- Level: select Info, Warn, Error, or a combination.
- Status: choose a status group such as 4xx or 5xx, or enter an exact code such as
503. - Method: select one or more HTTP methods.
- Host: select one or more available hostnames.
- Path: select suggested paths or enter a path to add it to the filter.
- Request ID: narrow the list to a particular request.
Use Reset to clear the sidebar filters while keeping your time range and search text.
Follow logs live
Select Live to insert incoming requests at the top of the list automatically. The selected button shows a pause icon; select it again to pause incoming updates. When paused, it shows a play icon. You can scroll through older logs while Live is active.
Online Live uses Cloudflare's live log stream. Local Live refreshes from the local workspace about once per second. Live updates pause while the page is hidden.
Use the Refresh icon to reload logs. Published logs can take time to become available in historical queries, so a request seen in Live may not appear in history immediately. If the live connection fails, use Reconnect when prompted.
Export or copy logs
Open the three-dot menu to the right of the time selector:
- Export CSV saves one row per loaded log event, with request metadata, message text, and any recorded stack or structured data.
- Export JSON saves the loaded requests with their grouped log events.
- Copy visible logs copies the loaded list as text, including timestamps, levels, request IDs, and messages.
All three actions use the current filtered list already loaded into the table, including rows loaded by scrolling. They do not fetch every matching request in the selected time range. Scroll to load any additional history you need before exporting. CSV and JSON exports open a save dialog; their timestamps use UTC.
If logs are missing
- Check that you selected the environment where the request ran: Local for the preview or Online for the published app.
- Clear restrictive filters and choose a time range that includes the request.
- Make another request, then enable Live or select Refresh. Historical Online logs may arrive later than Live logs.
- If Online shows Collection off · Redeploy to enable, publish a new release to enable collection for that deployment.
Partial results means the historical query returned only part of the matching data. Truncated in request details means some recorded content was cut short. Narrow the time range or filters to inspect the relevant request more closely.