

Analytics
Understand your published website's traffic, receive scheduled email reports, and export filtered results.
Analytics shows how people find and use your published website. It is built into every project and enabled by default, with no tracking code to install or separate analytics account to connect.
View your traffic
- Publish your project if you have not already.
- Open Analytics in the project sidebar, above Database.
- Visit your published website, then allow a few minutes for visits to appear.
Visits to your production domain and connected custom domains appear in the same project. Local previews do not collect visits.
The report refreshes automatically every minute while the page is active. You can also use the Refresh icon beside the menu. Collection and processing take time, so refreshing does not make newly received visits appear immediately.
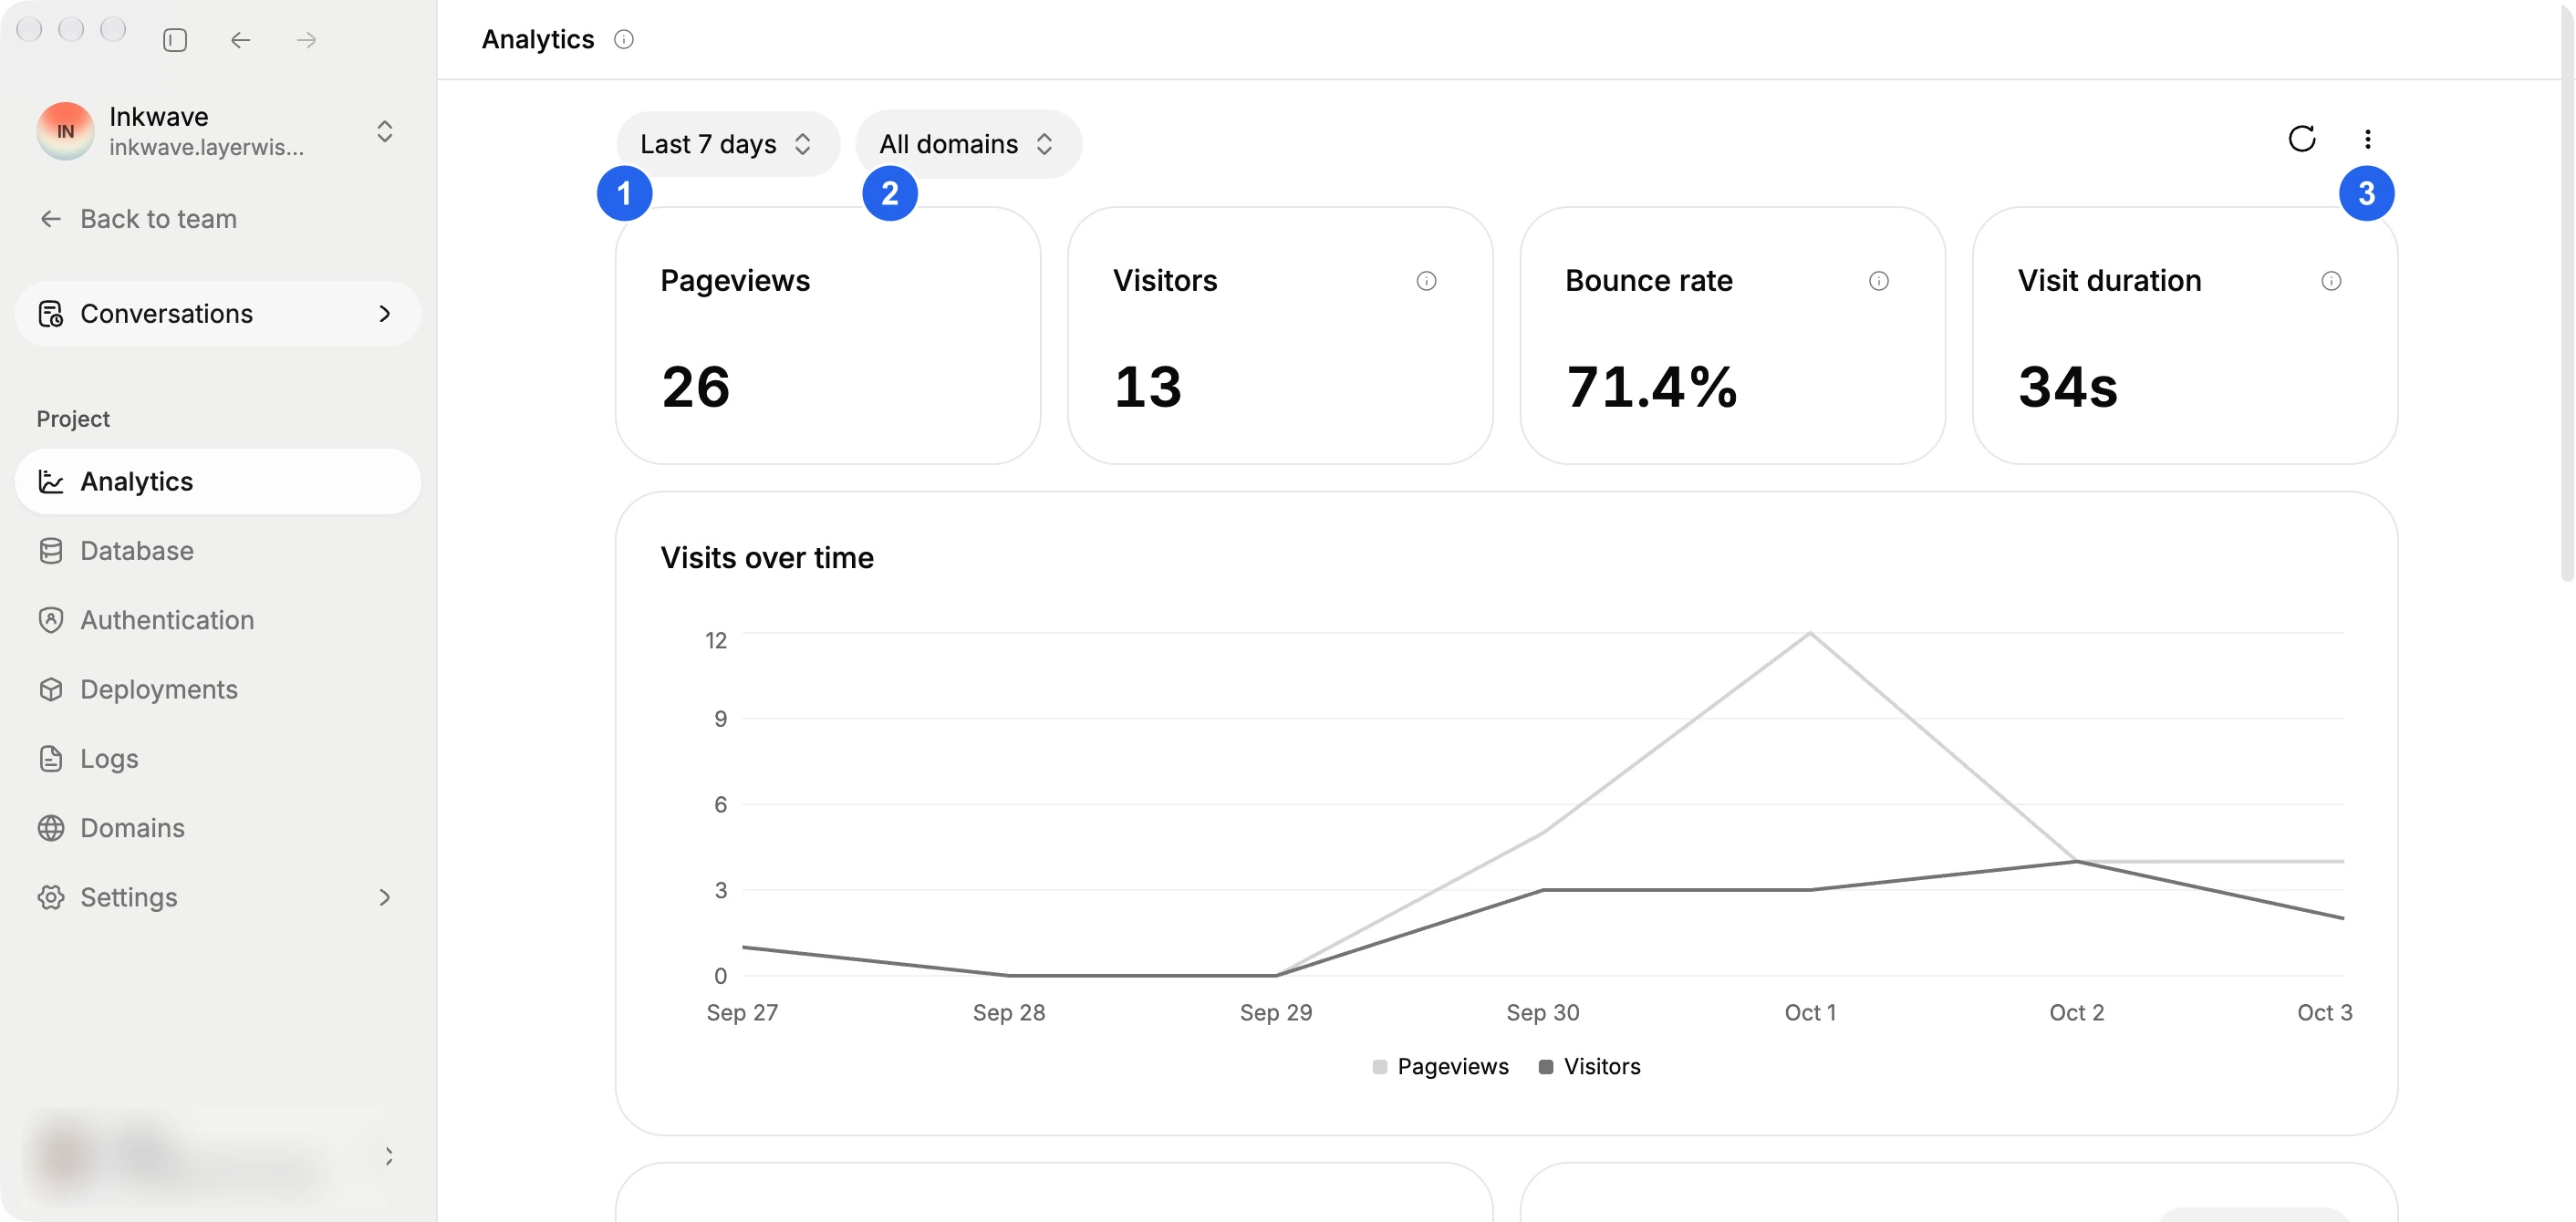
Use (1) the date selector and (2) the domain selector to narrow the report. (3) opens the report menu.
Read the summary
| Metric | Meaning |
|---|---|
| Pageviews | The number of recorded page views, including navigation between pages. |
| Visitors | Estimated daily unique visitors, summed across the selected range. The same person can count again on another day; this is not a count of distinct people across the entire range. |
| Bounce rate | The percentage of visits containing only one pageview. A new visit starts after 30 minutes without a pageview. |
| Visit duration | Average time between the first and last pageview in a visit. Time on the last page is not measured, and single-page visits count as zero seconds. |
The Visits over time chart shows pageviews and visitors across the selected range.
Changes beside the summary numbers compare against the preceding period with the same filters. Hover over a change to see the comparison details. When the previous period has no visits, the change is hidden. If a metric rises from zero, its change is labeled New instead of a percentage. Changes, including bounce rate, are relative percentages.
Choose a date range
Use the date selector at the top of the report. Dates and chart times follow your computer's local time zone.
- Today starts at local midnight. Last 24 hours is a rolling window ending now, so it can include part of yesterday.
- This week, This month, This quarter, and This year start at the beginning of the current calendar period. Weeks start on Monday.
- The Last… options let you review recent days, months, or years, subject to your team's plan.
- For exact dates, select Custom dates, choose a start and end date in the calendar, then select Apply.
Ranges ending today compare through the same local time in the previous period. Last 24 hours compares against the preceding 24 hours.
Filter and explore
Choose a domain next to the date selector, or leave All domains selected to combine the project's domains. Then use the breakdown cards to narrow the report:
| Card | What you can do |
|---|---|
| Pages | Click a path to filter by that page. Use the external-link icon to open it in your browser. |
| Sources | Switch between referrers and UTM source, medium, or campaign values, then click a value to filter by it. Direct means no referring domain was recorded. |
| Countries | Click a country to filter by the estimated visitor location. |
| Technology | Switch between devices, browsers, and operating systems, then click a value to filter by it. |
Filters apply across the report, so you can combine a domain, page, and country to explore a particular audience. Remove a filter using its chip above the report.
Click Pageviews or Visitors in a table header to sort by that count. Tables initially sort by pageviews from highest to lowest. Pages, Sources, and Countries show ten rows per page; use their pagination controls to see more results.
For campaign reporting, add utm_source, utm_medium, and utm_campaign to links you share. For example:
https://your-app.layerwise.site/?utm_source=newsletter&utm_medium=email&utm_campaign=launchUse campaign labels, not personal information, in these values. Ordinary query parameters and URL fragments are excluded from the tracker payload.
Export a report
- Select the date range and filters you want.
- Open the three-dot menu at the top right and choose Export CSV.
- Choose where to save the file.
The export includes summary metrics, the time series, and breakdowns for the selected filters. It includes all matching breakdown rows, not just the current table page, along with the report's time zone and filter details.
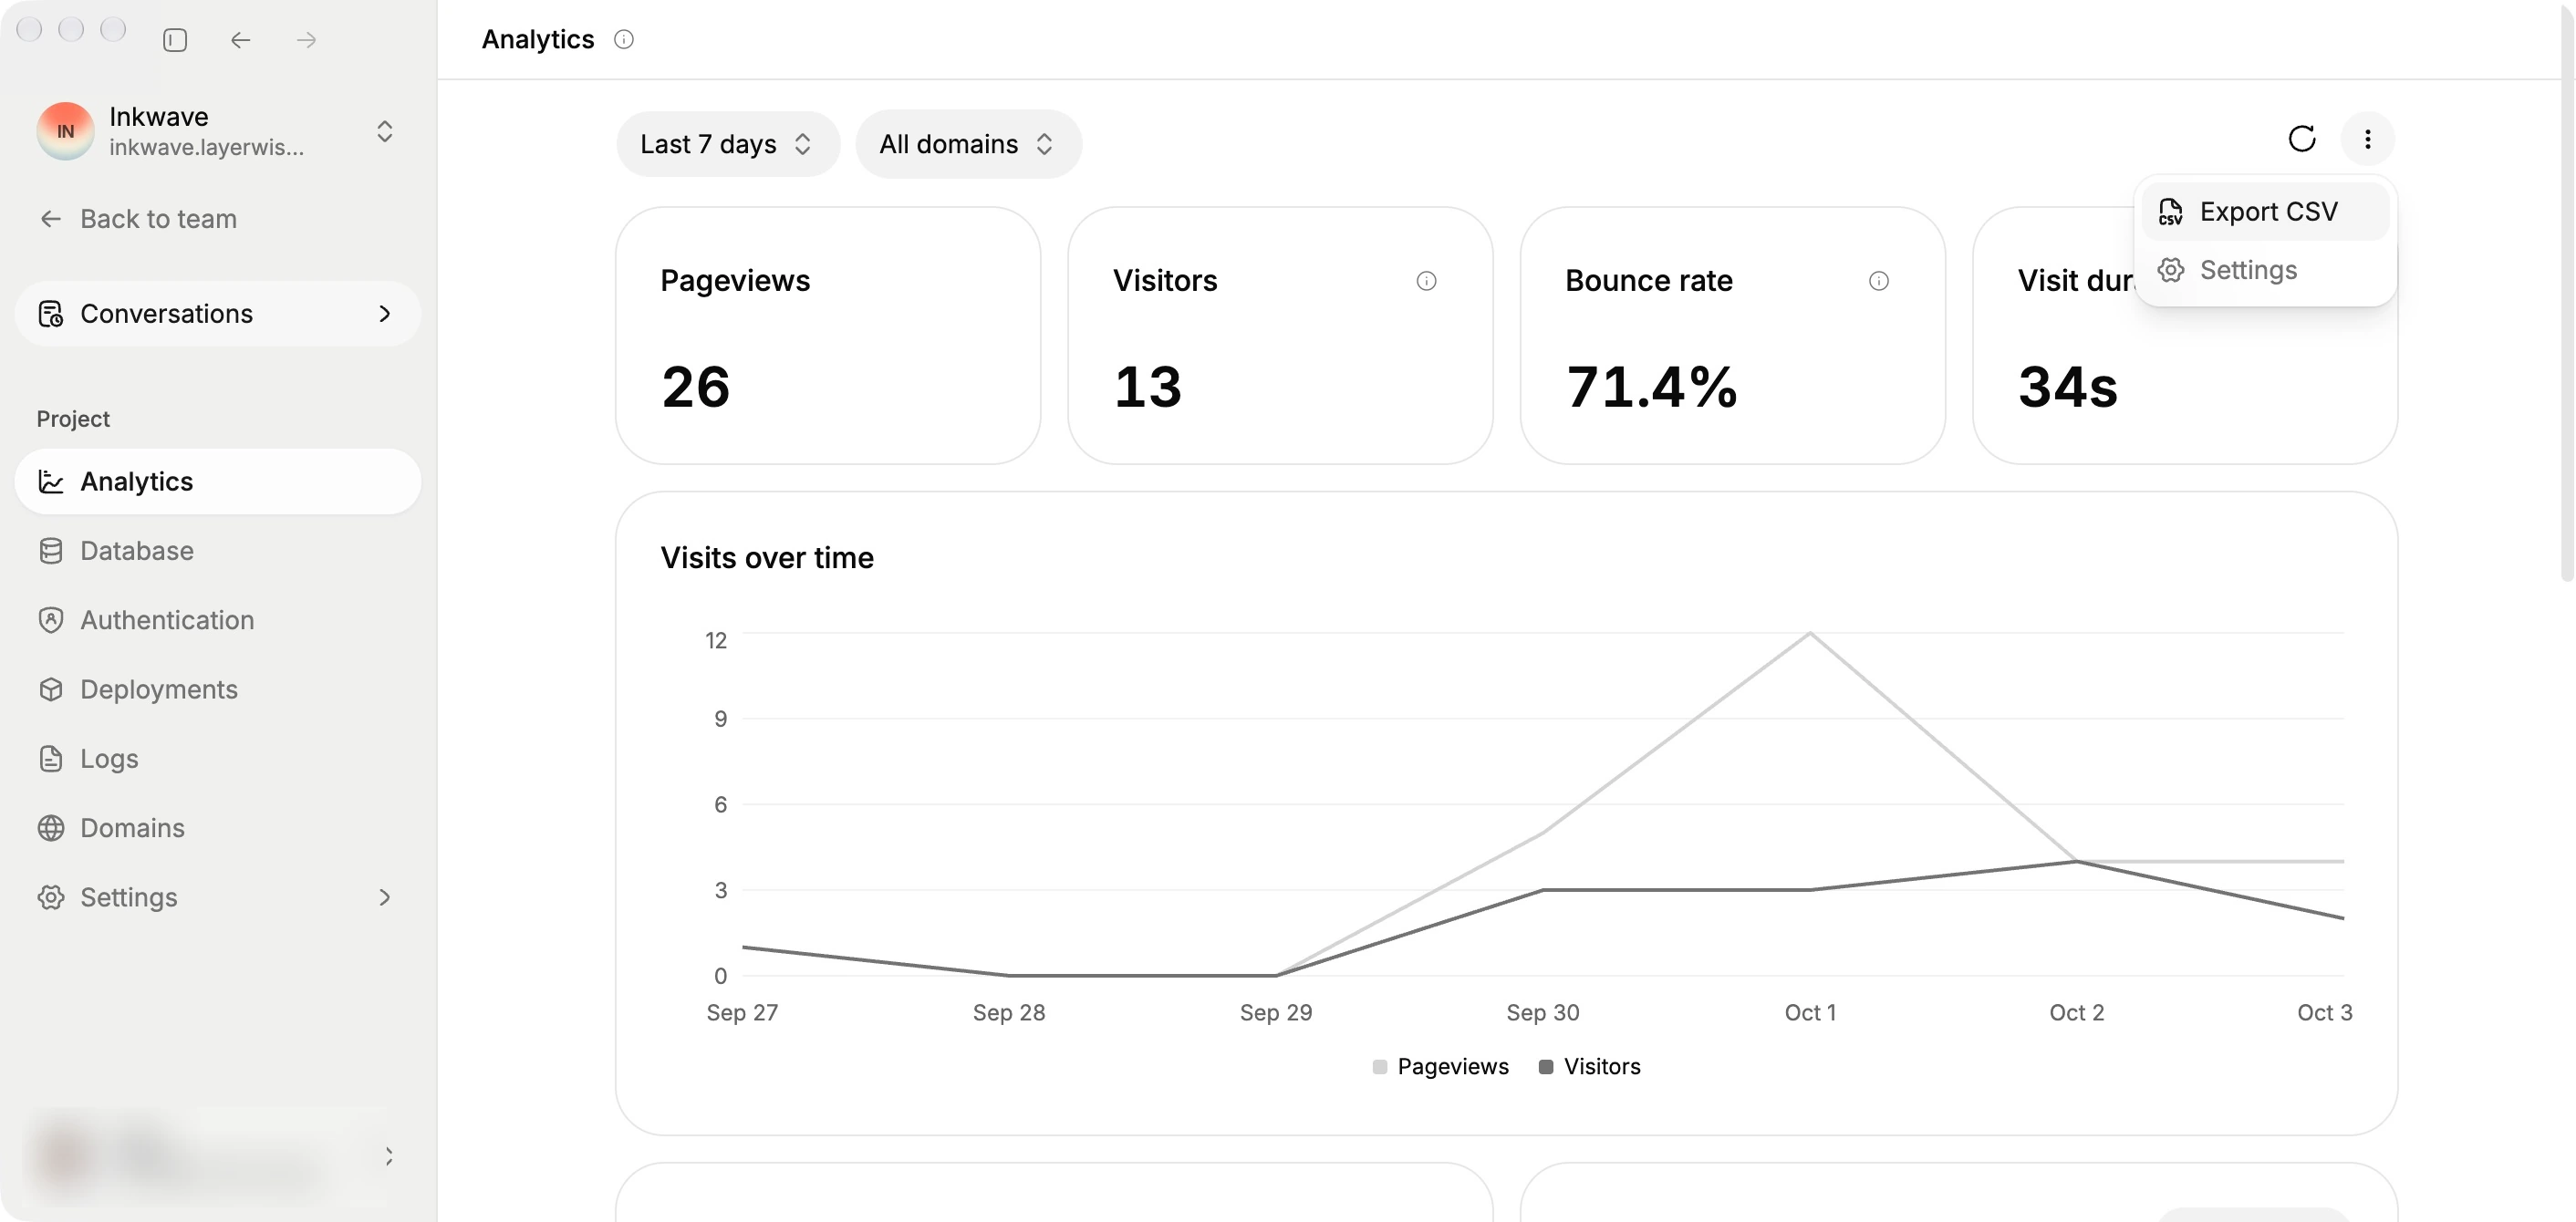
Choose Export CSV from the report menu to save the selected report.
Receive email reports
Get a regular summary of your published website's traffic by email.
- Open the three-dot menu in Analytics and select Settings.
- Keep Collect visits on to show the Email reports setting.
- Choose Monthly, Weekly, or Off, depending on your team's plan.
- Select Confirm to save.
| Plan | Available frequencies | Default |
|---|---|---|
| Free | Off | Off |
| Pro | Monthly or Off | Monthly |
| Business | Weekly, Monthly or Off | Weekly |
| Enterprise | Weekly, Monthly or Off | Weekly |
Reports are enabled by default on paid plans. Options that require an upgrade show the required plan; selecting one opens an upgrade dialog and keeps your current frequency.
Each project has one report recipient. Saving an enabled schedule sends future reports to your verified account email. Before anyone saves the schedule, reports go to the project's creator. The recipient must still belong to the team.
The schedule uses the time zone shown in Settings:
- Monthly reports cover the previous calendar month and are scheduled for the 1st at 9:00 AM.
- Weekly reports cover the previous Monday through Sunday and are scheduled for Monday at 9:00 AM.
Emails include the summary metrics and comparisons, visits over time, and the Pages, Sources (including UTM values), Countries, and Technology breakdowns. Each breakdown shows up to ten entries, ordered by pageviews. Reports cover all of the project's domains; filters selected in the dashboard do not change the email report.
When Collect visits is off, Email reports is hidden and scheduled emails pause. Turning collection back on resumes the saved frequency. To stop emails while continuing to collect visits, select Off and confirm.
History available on your plan
Your team's subscription determines how far back you can view and export data:
| Plan | Available history |
|---|---|
| Free | Latest 7 days |
| Pro | Latest 6 months |
| Business | Latest 1 year |
| Enterprise | Latest 3 years |
Selecting a range beyond your plan's history opens an upgrade dialog. Upgrading can unlock older data that was already collected and is still retained. It cannot recover visits from before collection began or after data was deleted.
Report access and data retention are separate. See Analytics privacy and retention for the retention and deletion policy.
Pause collection
- Open the three-dot menu and select Settings.
- Turn Collect visits off.
- Select Confirm to save the change.
Pausing keeps existing history available. Turn the setting back on and confirm to resume collection. Changes may take a short time to reach the published website, and requests already in progress may still arrive. Team viewers cannot change this setting.
If you do not see visits
- Publish the project first, then visit its live URL rather than the local preview.
- Check that Collect visits is on.
- Allow a few minutes for processing, then refresh.
- Check the selected date range, domain, and filter chips. A published project with no matching visits shows zero values.
- Browser extensions and a site's Content Security Policy can prevent collection. Reports may therefore show fewer visits than actually occurred.
Privacy
The built-in tracker does not set tracking cookies or store persistent visitor identifiers in the browser. Raw IP addresses are not stored in Analytics events. Visitor counts are estimates, and cookie-free does not mean that all collected data is anonymous.
Read Layerwise Analytics Privacy for the fields collected, processing, and deletion details. That notice covers Layerwise's built-in Analytics; your website still needs its own privacy information for forms, accounts, payments, and any other tools you add.