How to Build a Sales Dashboard with AI
Build a sales dashboard with AI in Layerwise. Define deals and stages, save records, calculate pipeline and revenue from them, set access, and publish.
Table of contents
A sales dashboard is useful only when the team trusts its numbers. An AI app builder can draw charts quickly, but a chart is only as reliable as the records and calculations behind it.
This guide builds a sales dashboard for a small team in Layerwise. You will define the deal record, start from the Sales Dashboard template or a new prompt, save deals in the project database, calculate the dashboard from those records, set access rules, and publish.
1. Decide the metrics and the deal record
Start with the questions the dashboard should answer: How much open pipeline do we have, and in which stages? How much revenue did we win each month? Which deals should close this month, and who owns them?
Each question depends on stored fields. A workable deal record:
| Field | Type | Notes |
|---|---|---|
| Company | Text | Required |
| Owner | Signed-in user | The teammate responsible for the deal |
| Amount | Integer, in cents | Avoids rounding errors; one currency |
| Stage | One of six stages | Lead, Qualified, Proposal, Negotiation are open; Won, Lost are closed |
| Expected close date | Date | For forecasting, not revenue |
| Closed date | Date | Set when the stage changes to Won or Lost |
Then define each metric in terms of those fields:
- Open pipeline is the sum of Amount for deals in the four open stages.
- Pipeline by stage is the count and total Amount for each open stage.
- Won revenue by month is the sum of Amount for Won deals, grouped by the month of their Closed date.
Writing this down prevents a quiet error: revenue charted by created date or expected close date, which puts deals in the wrong month.
2. Choose a starting point
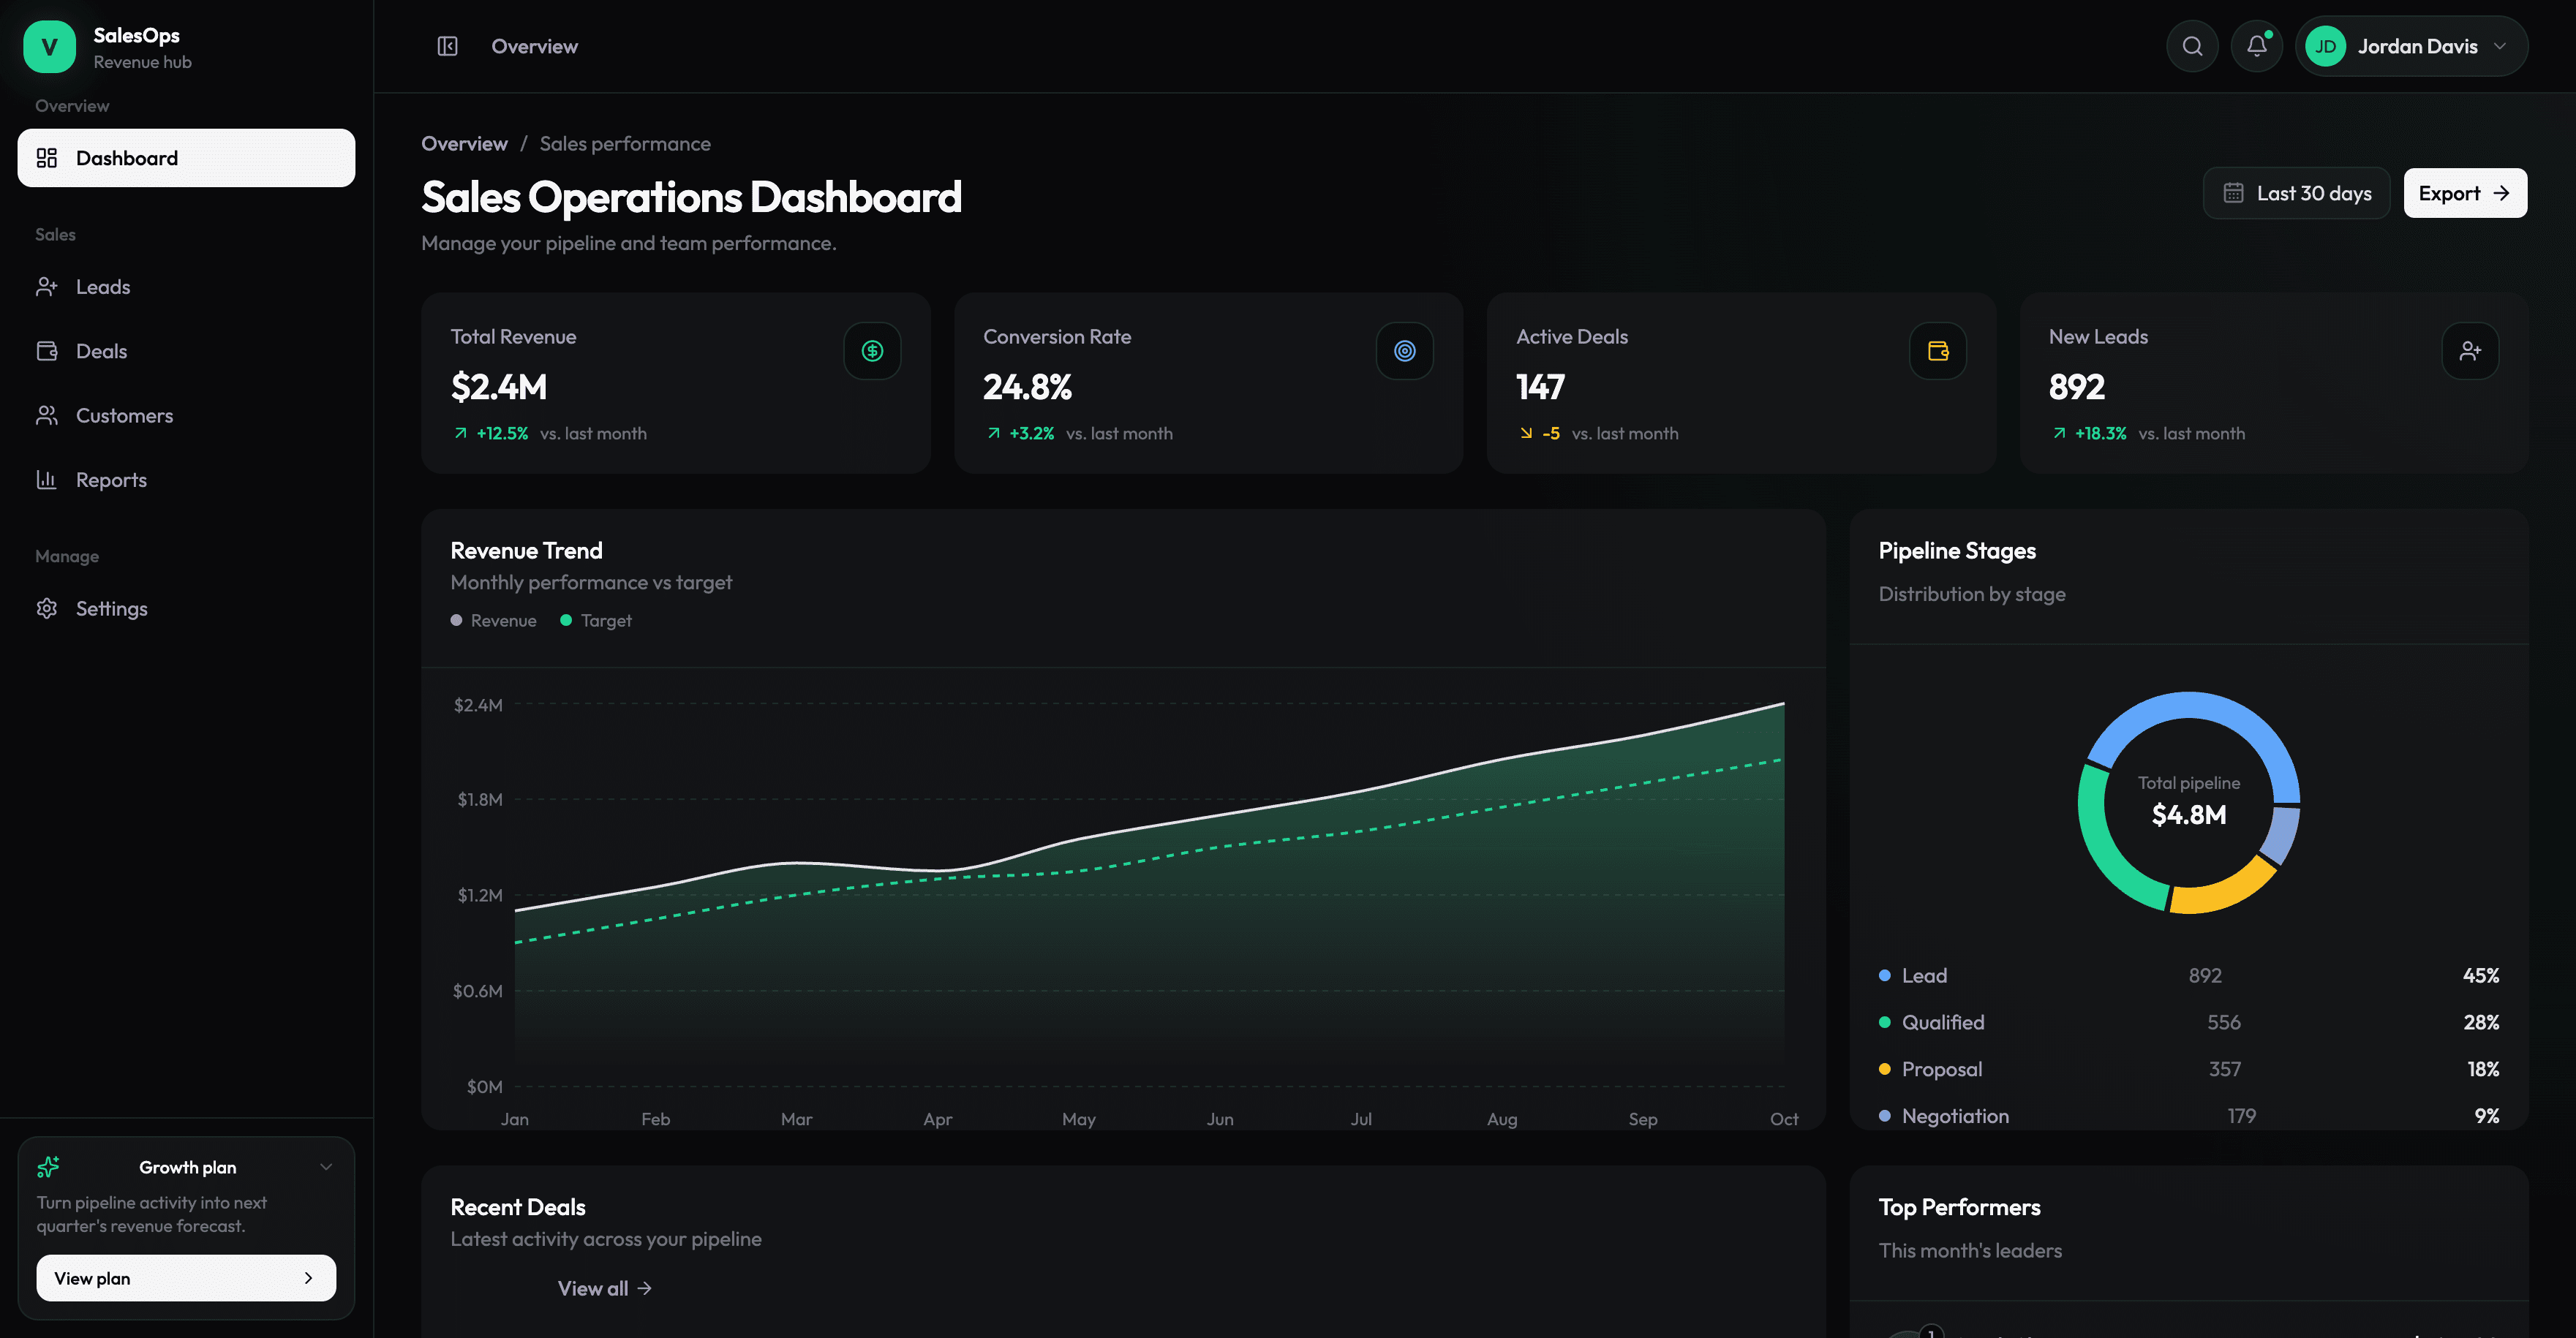
The template provides summary cards, a Revenue Trend chart comparing monthly revenue with a target, a Pipeline Stages chart, a Recent Deals table, and a Top Performers list, built with Recharts. All of it is sample data in the page code; the Leads, Deals, Customers, and Reports sidebar entries do not open pages yet, and there is no CRM integration. To copy it, choose Use this template on the template page, select a team and project name in Layerwise, then choose Copy to Layerwise. Other starting points are in the template gallery.
To start from a description, install Layerwise, sign in, and choose a team. Enter your prompt in Describe the app you want to build..., choose a model, and send it:
Build a sales dashboard for a six-person B2B sales team. Teammates sign in
with email. A Deals page lists each deal's company, owner, amount, stage,
expected close date, and closed date. Stages are Lead, Qualified, Proposal,
Negotiation, Won, and Lost. The dashboard shows open pipeline by stage, won
revenue by month, and deals expected to close this month.
The prompting guide covers how to describe users, data, and screens.
3. Turn sample data into saved deals
From the template, replace the fixed arrays with records. This touches the schema, a new page, and the dashboard, so consider turning on Plan mode to review the approach first.
Add a deals table to the project database with company, owner (a signed-in
user), amount in cents, stage, expected close date, and closed date. Make the
Deals sidebar item open a page to create, edit, and delete deals. Set the
closed date when a deal moves to Won or Lost. Move the sample deals out of the
page code and into local seed data.
Whichever start you chose, create a deal in the preview and refresh; it should remain. Then open Database in the project sidebar, select Local, and double-click a cell to change a deal's amount. Refresh the preview and confirm the app shows the new value, which proves the page reads saved records. See the database guide.
4. Calculate every number from the records
A dashboard can save deals and still display sample figures. In the template, the Total pipeline amount inside the Pipeline Stages chart is a fixed value, and the summary cards compare against last month without stored history.
Calculate every dashboard number on the server from the deals table. Open
pipeline is the sum of amount for Lead, Qualified, Proposal, and Negotiation
deals. The revenue chart groups Won deals by the month of their closed date.
Remove the target line and the change percentages until we store targets.
Test with totals you know. Delete the seed rows in Database and add three deals: $10,000 in Lead, $25,000 in Proposal, and $40,000 Won this month. Open pipeline should read $35,000 and this month's revenue $40,000. Move the Proposal deal to Won: pipeline drops to $10,000 and revenue rises to $65,000. Move the Lead deal to Lost; it should count toward neither. You can also ask the agent to run this path in the preview.
5. Set access rules for the team
Every Layerwise project includes email sign-in, but who can see and change deals is up to your app:
Require sign-in for every page and request that reads or changes deals. All
teammates can view every deal. A teammate can edit only deals they own.
Managers can edit any deal and reassign its owner. The first account is a
manager and can promote others. Enforce these rules on the server.
Open Authentication in the project sidebar, select Local, and use Add user to create test accounts. Sign in as each one: a teammate should get an error when editing someone else's deal. Hiding an Edit button is not enough; the server must refuse the change. See the authentication guide.
If everyone who needs the dashboard is on your Layerwise team, you can also turn on Private in the Publish menu so only team members can open the live URL. This requires a paid plan, and your app's rules still decide who can change each deal.
6. Test the edges, then publish
Before publishing, confirm that an account with no deals sees a clear empty state, the totals and Deals list work at phone width, and a form missing an amount or stage saves nothing.
Then choose Publish in the preview header and Publish again in the menu. Local and Online use separate databases: publishing applies the schema to production but does not copy local deals or test accounts. On the live URL, create an account, add a deal, and repeat the totals check. See Publish a project.
You can add a few real deals in Database under Online, which changes live data immediately. If your records live in an existing CRM, ask for an import:
Add a CSV import for managers on the Deals page. Show a preview with row-level
errors before saving, and reject rows with an unknown stage or owner email.
7. Improve it with analytics and logs
Once the team uses the dashboard, open Analytics in the project sidebar. The Pages breakdown shows whether people open the Deals page or only the dashboard. Visitor counts are estimates, so use them for direction.
When a teammate reports a failed save, open Logs, select Online, and filter by a 5xx Status or the request's Path. Include the error and the action that caused it in your next message. The Analytics and Logs guides cover the filters.
Build the first version around one record and three numbers you can check by hand. When those match, add targets, forecasts, or integrations one at a time. To start with the layout in place, open the Sales Dashboard template.