Dashboard
Sales Dashboard Template with Revenue Charts
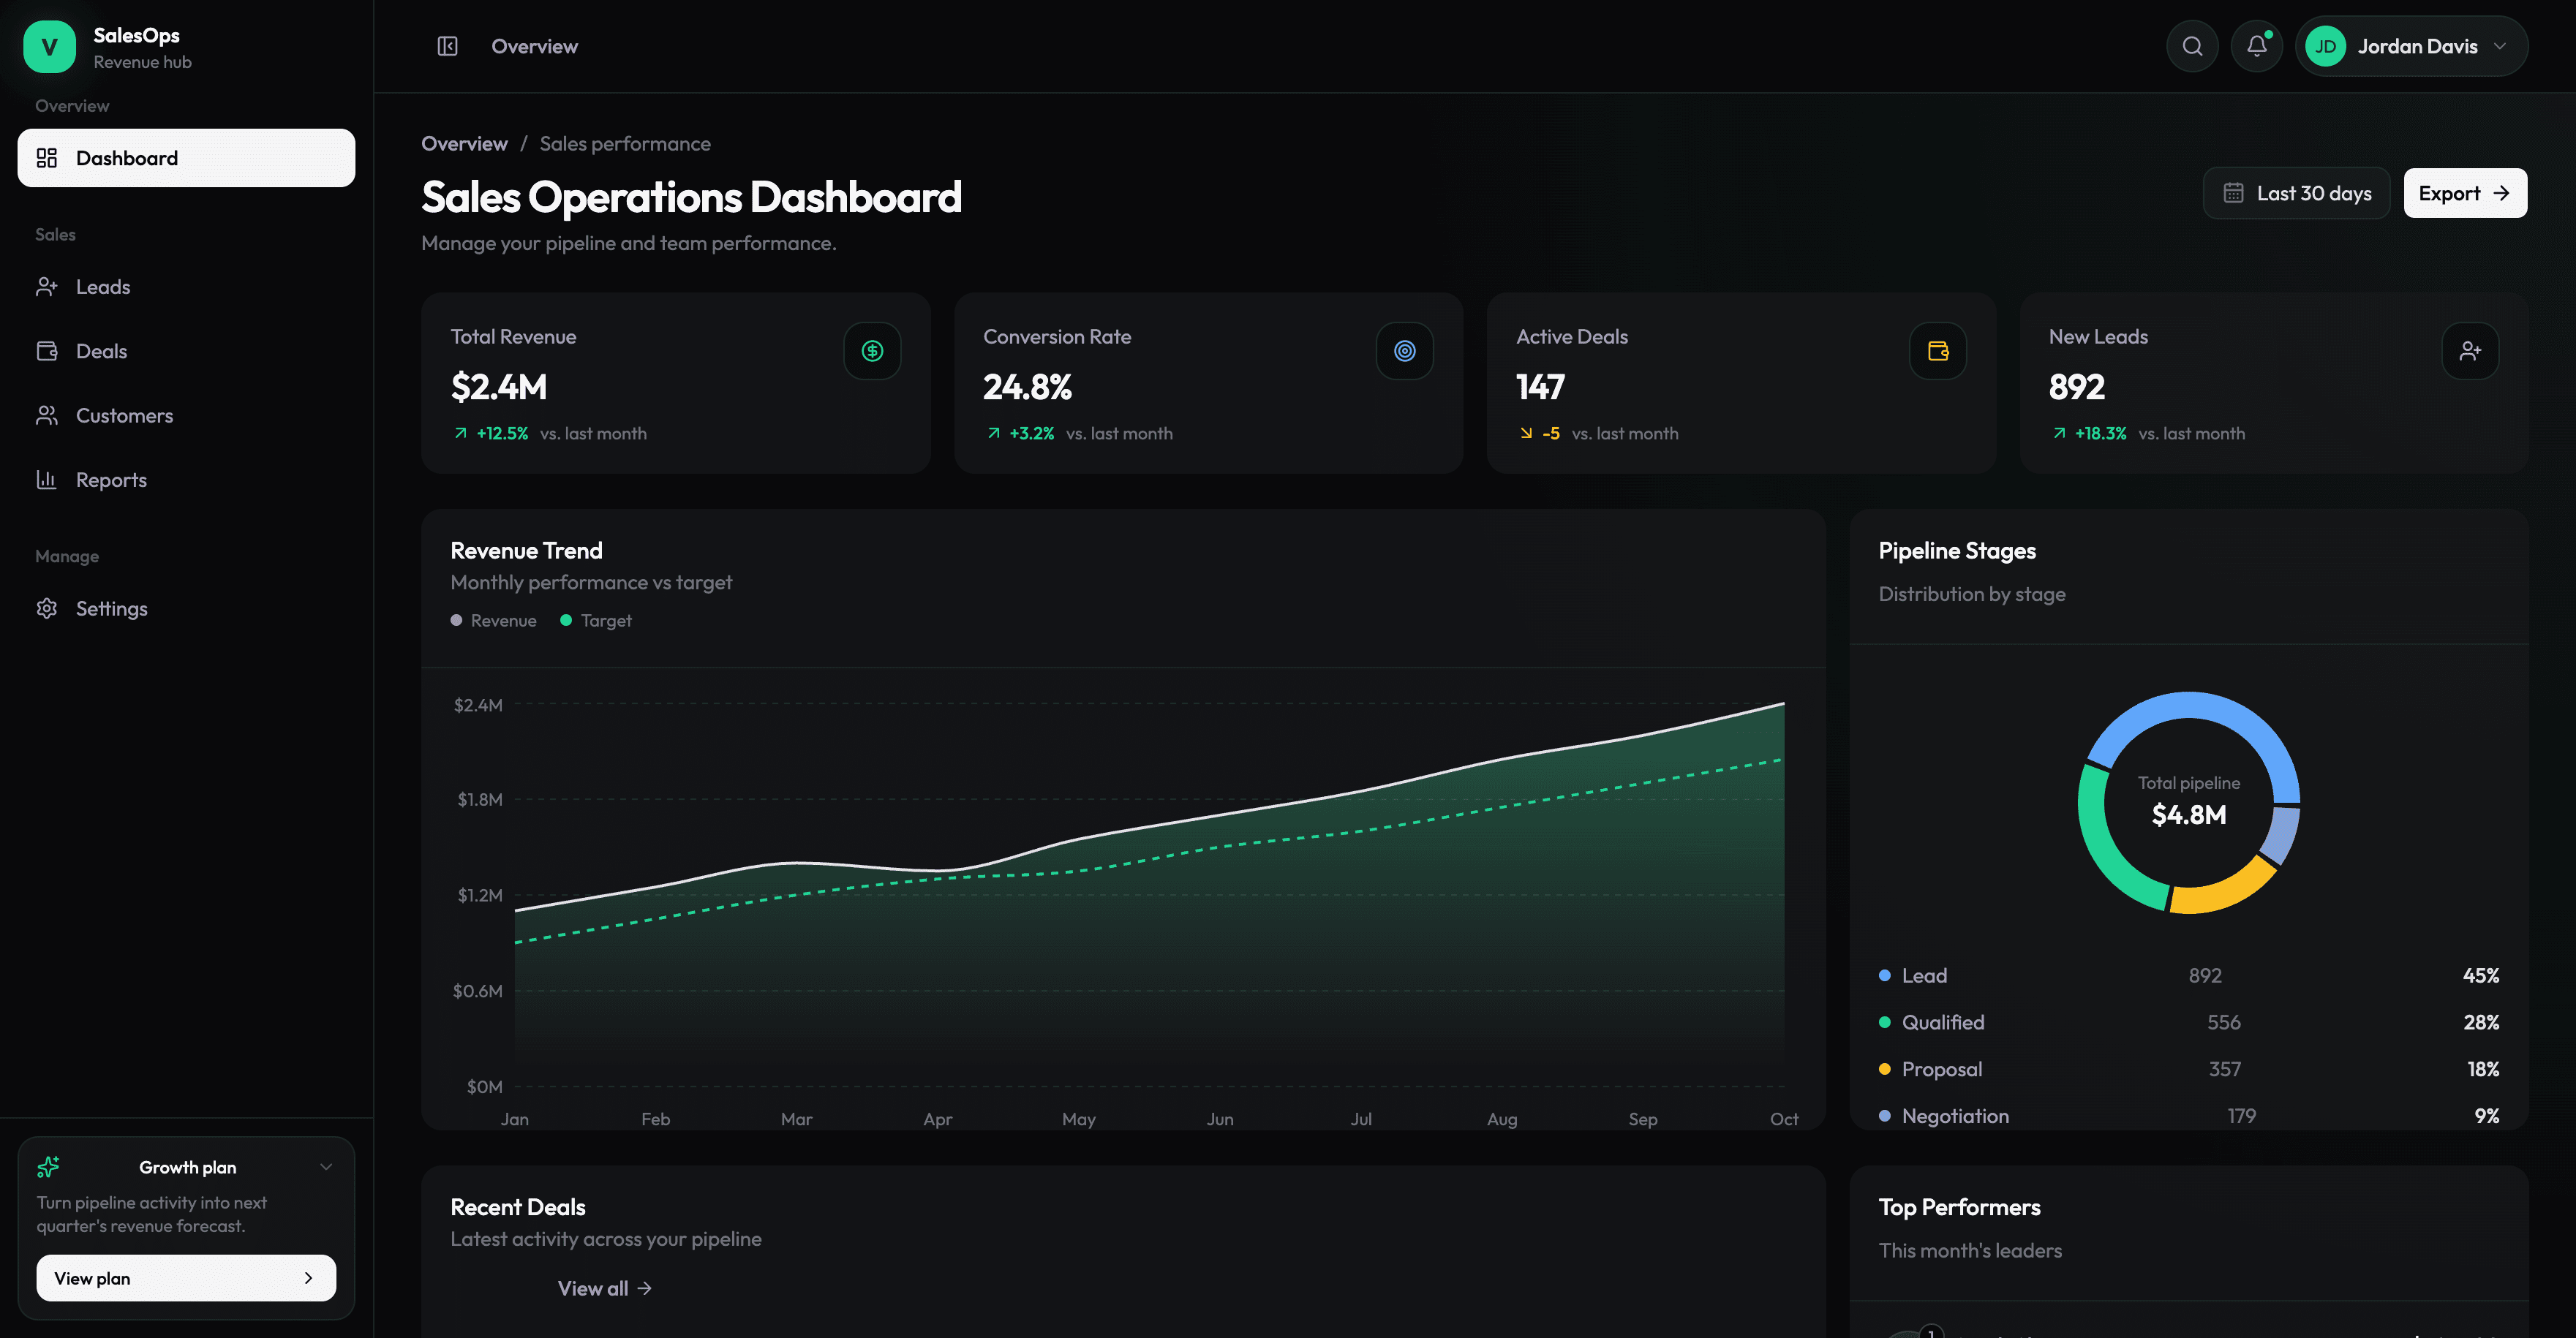
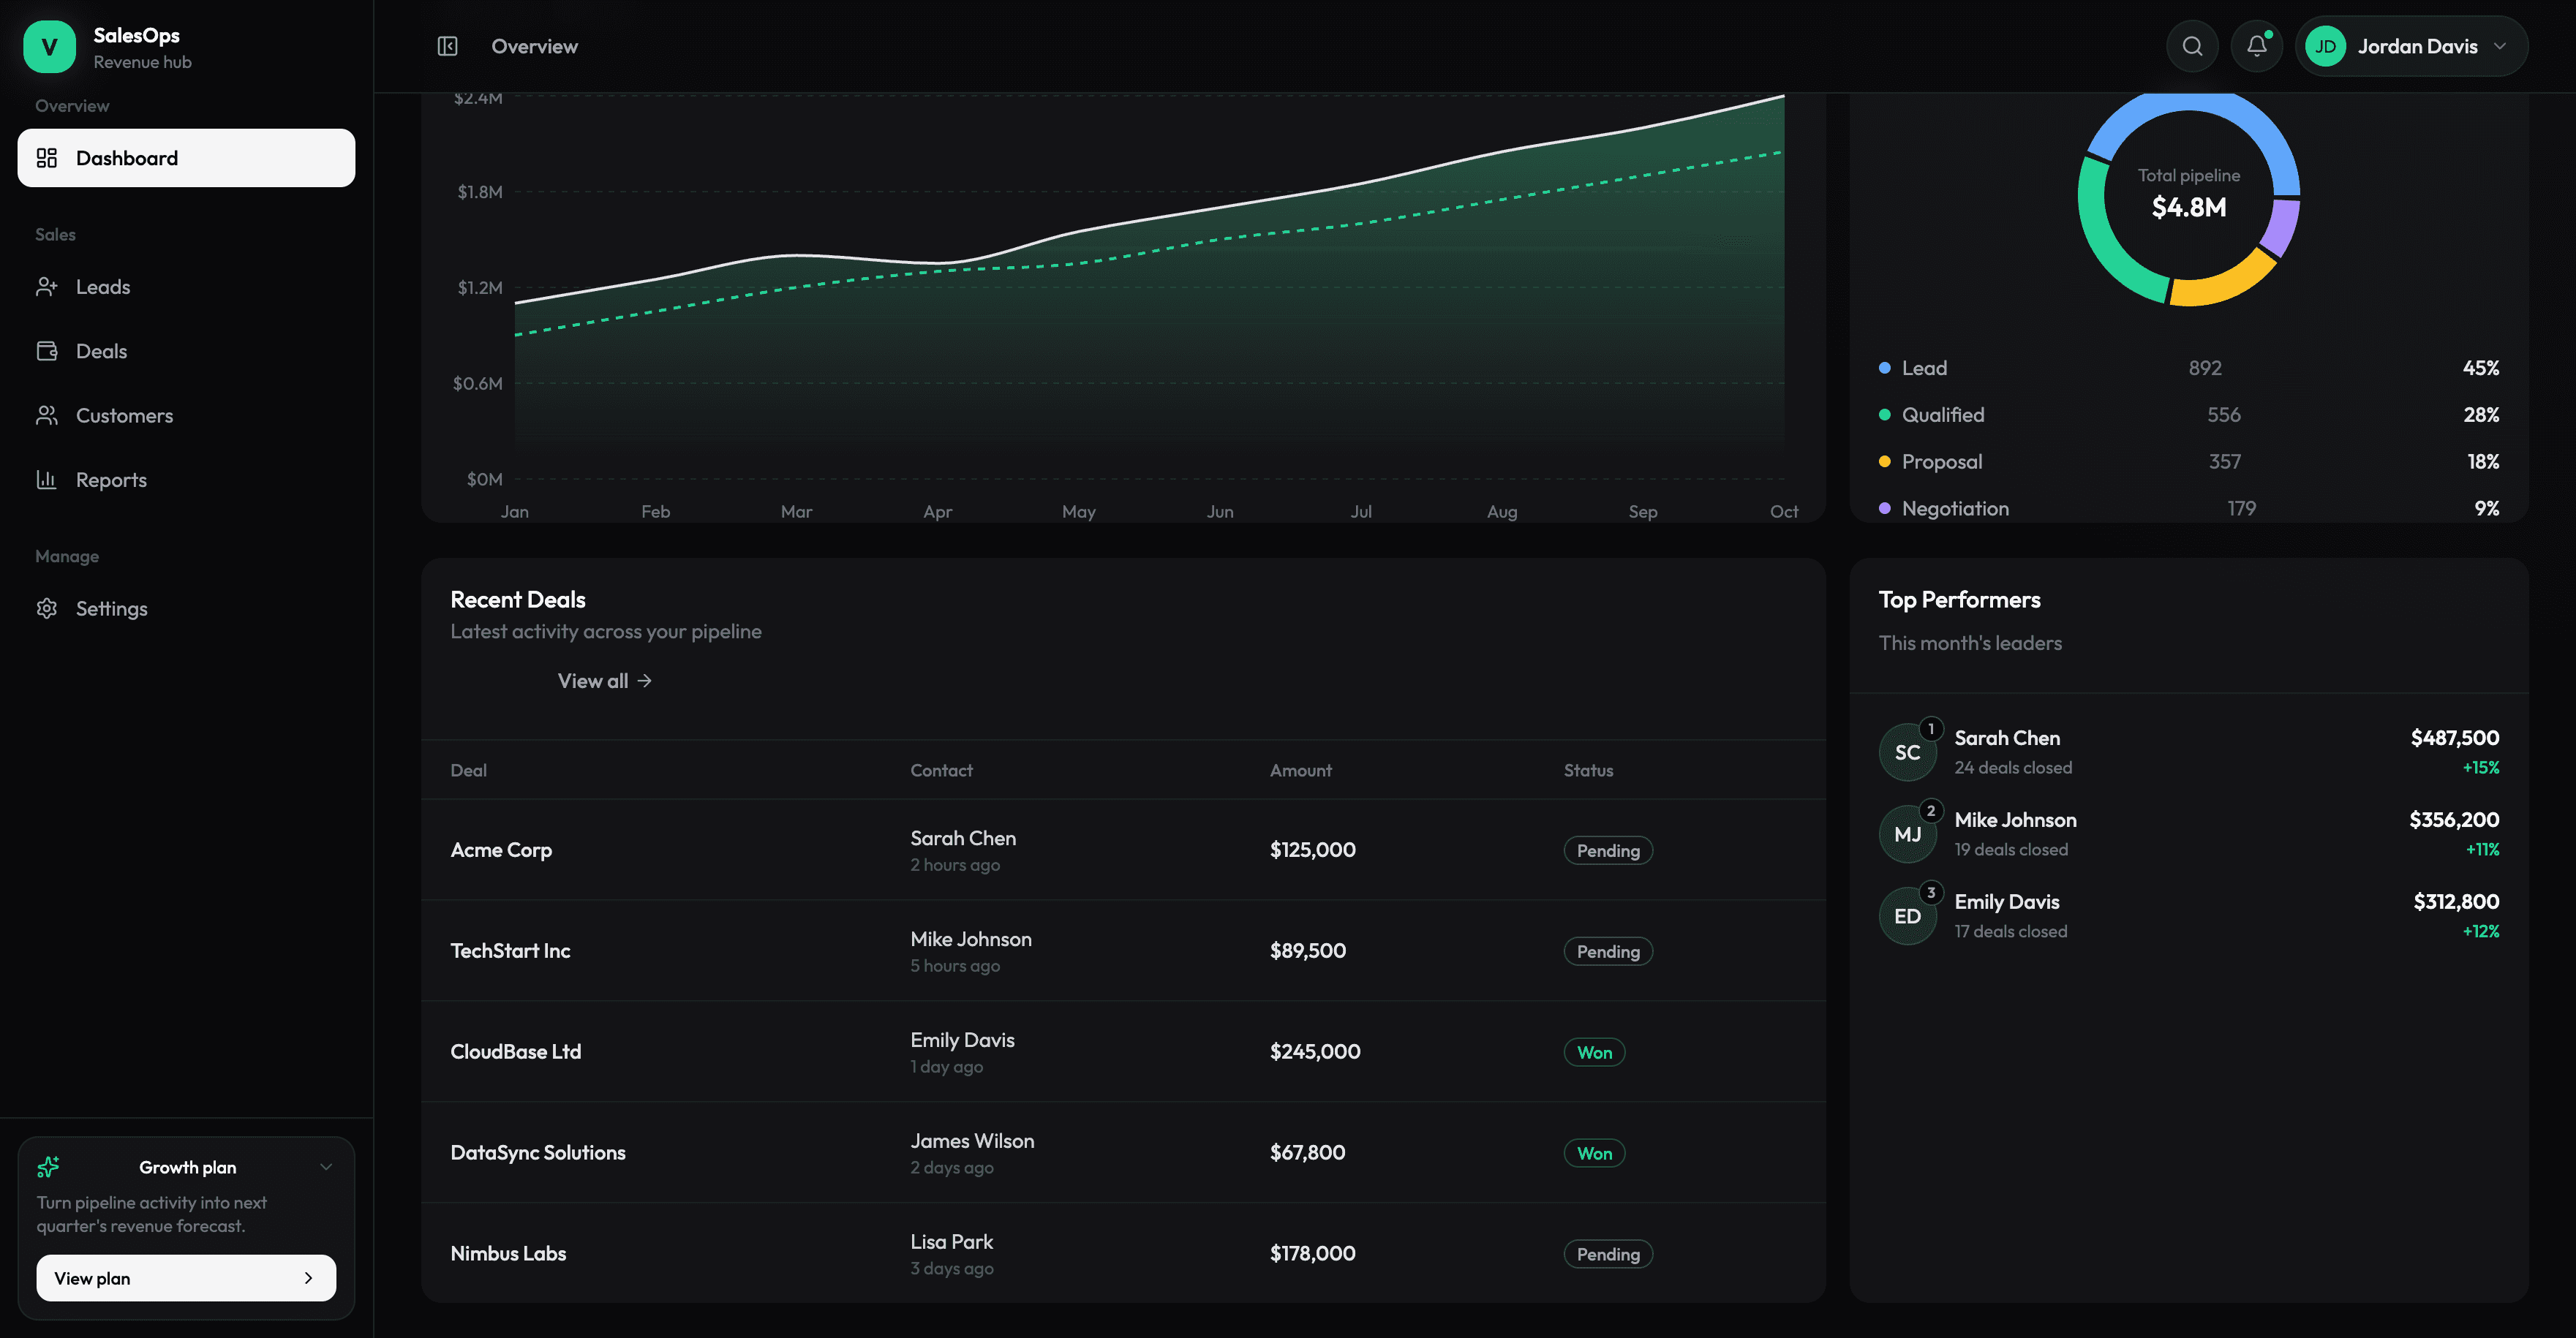
Start with a dark sales dashboard featuring revenue trends, pipeline stages, recent deals, and team performance. Built with Layerwise, React, TanStack Start, and Recharts, it includes a responsive layout and collapsible sidebar. The charts and tables use sample data, ready to connect to your own sales workflow.
The button opens Layerwise on your computer. If it does not open, download the app first and try again.
Open itBuild your own version of Sales Dashboard
Use this template as the interface for an internal sales tool. It gives you a way to explore revenue, pipeline stages, deals, and team performance before you connect real records.
What the template includes
- Revenue trends, pipeline stages, recent deals, and team performance views.
- A responsive dark layout with a collapsible sidebar.
- Sample data in the charts and tables; a live CRM integration is not included.
The template opens as a local project you can change through the conversation or the code editor. You can inspect the source for this template version before choosing how to extend it.
Copy it and make one useful change
- Install Layerwise and sign in. Choose Use this template, select a team and project name in the app, then choose Copy to Layerwise. Wait for setup and the local preview to finish.
- First define a deal: its name, owner, value, stage, and expected close date. Replace sample figures with your own data source only after deciding how the metrics should be calculated.
- Ask for the change in the project conversation. This prompt is a starting point; adjust it to describe your intended result.
Turn this dashboard into a sales tool for a small consulting team. Add a deal form with company, owner, value, stage, and expected close date. Save deals in the project database, derive the pipeline total from those records, and show an empty state when there are no deals. Keep the existing visual style.
Check the result before publishing
- Create a deal, refresh the preview, and confirm the record remains available.
- Change a deal’s stage and value; the table and pipeline totals should reflect the same records.
- Test an empty dataset and the phone layout instead of relying on the sample dashboard.
For a shared dashboard, specify who may view and edit deals and verify those permissions with separate accounts. Define a separate import or integration workflow if your records come from an existing CRM.
Use the local preview controls to test the affected path. When it works, publish a release and repeat the check at the live URL. For saved records or accounts, read about the separate Local and Online databases.
Preview